Population of large cities of Crimea. Crimea: urban population and ethnic composition. Further development of Crimea
Crimea is an amazing land. Not only in terms of natural landscapes, but also from the point of view of its inhabitants. The peninsula has been inhabited since ancient times. The Scythians, Sarmatians, ancient Greeks and Romans left their mark here. In this article we will talk about modern settlements of Crimea - the largest cities and villages.
Republic and administrative-territorial structure
As of the beginning of 2018, 1.91 million people live in Crimea. About half of them live in cities. The ethnic structure of the population is dominated by three peoples: Russians (about 63%), Ukrainians (15%) and Crimean Tatars (12%). In addition, representatives of almost a hundred other nationalities also live on the peninsula. Among them are Armenians, Belarusians, Tatars, Greeks, Moldovans, Jews, Bulgarians and other nationalities.
According to the current administrative-territorial structure, the territory of Crimea is divided into 11 urban districts and 14, although located on the peninsula, are not part of the republic. The “capital” of the Crimean land is the city of Simferopol.
Settlements of Crimea
In Crimea today there are 1019 settlements. These include 16 cities, 56 towns and 947 villages. What are the largest settlements in Crimea? The ten largest Crimean cities by population are listed below:
- Sevastopol (436 thousand people).
- Simferopol (342 thousand people).
- Kerch (150 thousand people).
- Evpatoria (106 thousand people).
- Yalta (79 thousand people).
- Feodosia (68 thousand people).
- Dzhankoy (39 thousand people).
- Krasnoperekopsk (25 thousand people).
- Alushta (30 thousand people).
- Bakhchisaray (27 thousand people).
The list of the largest rural settlements in Crimea is as follows:
- Mirnoe (9.28 thousand people).
- Vilino (6.96 thousand people).
- Pionerskoye (5.53 thousand people).
- Clean (5.13 thousand people).
- Bright Field (4.91 thousand people).
The largest populated areas of Crimea are marked on the map below:
Simferopol
Simferopol (translated from ancient Greek as “city of benefit”) is an administrative, important economic, cultural and educational center on the peninsula. Here is the largest university in Crimea - Tauride University named after. Vernadsky, as well as a number of other educational institutions.
Officially, the year of foundation of the city is considered to be 1784. Although it is known that Scythian Naples, the capital of the Scythians of Tauris, arose on this site back in the 3rd century BC. In the 16th-18th centuries, there was a village called Ak-Mechet, where the residence of the Crimean Tatar Sultan was located.

Administratively, Simferopol is divided into three districts: Central, Kyiv and Zheleznodorozhny. There are about 70 mechanical engineering, food and light industry enterprises in the city. Despite the abundance of architectural and historical monuments, tourists rarely pay attention to Simferopol, perceiving it only as a transit point on the way to the sea.
Village Nauchny
It is impossible not to mention in our article about the village of Nauchny. After all, this is the highest mountainous settlement in Crimea. It is located at an altitude of about 600 meters above sea level, 25 kilometers from Bakhchisarai. In Soviet times, the village of Nauchny was not marked on maps, and all letters addressed to its residents were de jure sent to Bakhchisarai. This secrecy was due to the fact that the largest astrophysical observatory was located here. It still works today. By the way, its domes are clearly visible from the top of Mount Ai-Petri.

Mirnoye and Vilino: demographic record holders
The largest village in Crimea is Mirnoye. It is home to at least nine thousand people! The village was founded at the end of the 18th century. Interestingly, Mirnoye is located just two kilometers from the Simferopol railway station. In fact, this is nothing more than the northwestern outskirts of the Crimean “capital”. The village has its own flag and coat of arms, which depict a white dove in flight.
The second most populous village on the peninsula is Vilino. It is also famous for the colossal growth dynamics of its population. Thus, over the past half century, the number of village residents has tripled. Even in 2000, the population of Vilino was growing, despite the general Ukrainian trend towards depopulation.
As a source, I used a useful article from Wikipedia “Population of Crimea”.
The article presents the results of population censuses for 1897-2014, and the abundance of tables always makes the text interesting.
Let's not look into the century before last, but it would be interesting to compare the results of the last Soviet census of 1989, the Ukrainian census of 2001 and the census conducted in Crimea in 2014.
The first table shows the national composition of the population of the entire Crimea (Republic and Sevastopol). I slightly changed the original table from Wikipedia, bringing together the East Slavic, Tatar and Jewish peoples. Nations whose share in the population of Crimea has increased over the period 2001-2014 are indicated in green.
Table 1. National composition of the population of Crimea according to census data.
As you can see, in the population of Crimea after joining the Russian Federation, the share of Russians noticeably increased, while the absolute number and proportion of Ukrainians and Belarusians sharply decreased. I believe that the reason for this jump is quite clear.
In general, the share of Eastern Slavs in the population of the peninsula has decreased over 25 years from 95 to 81 percent.
The share of Tatars increased sixfold between 1989 and 2014. According to Rosstat, part of the Crimean Tatars called themselves Tatars during the census. The appearance of the Turks is noteworthy.
According to the census, only 0.17% of the population of Crimea remained Jews.
In addition to the Tatars, there are five more peoples whose numbers are growing in Crimea. These are Armenians, Azerbaijanis, Uzbeks, Tajiks and Gypsies.
It is noteworthy that the share of those who did not indicate their nationality during the census increased in 2014 to 3.82%, compared to 0.82% during the Ukrainian census of 2001.
Table 2. National composition of the urban and rural population of Crimea as a percentage of the total.

Table 2 shows the shares of the number of people who indicated their nationality, and not of the total number of Crimeans. Therefore, the data for Crimea as a whole are somewhat different from the data in Table 1.
As we can see, in rural areas the share of Russians is significantly lower than in cities. On the contrary, the share of Tatars and Ukrainians is significantly higher in rural areas.
Table 3. How many times has the share of a particular national group increased (decreased) in 2001-2014.

As we can see, the share of Russians in the urban population increased by 13% during the period between the 2001 and 2014 censuses, and the share of Russians in the rural population increased by 22%. This is not surprising, because The share of those who called themselves Ukrainians and Belarusians in rural areas was initially higher, but with the change in the political situation everything fell into place.
What is important is the fact that the Tatar population moved significantly from the village to the city.

Table 4. National composition of urban districts and rural areas of Crimea.

Table 5. National composition of urban districts and rural areas of Crimea as a percentage of the total.
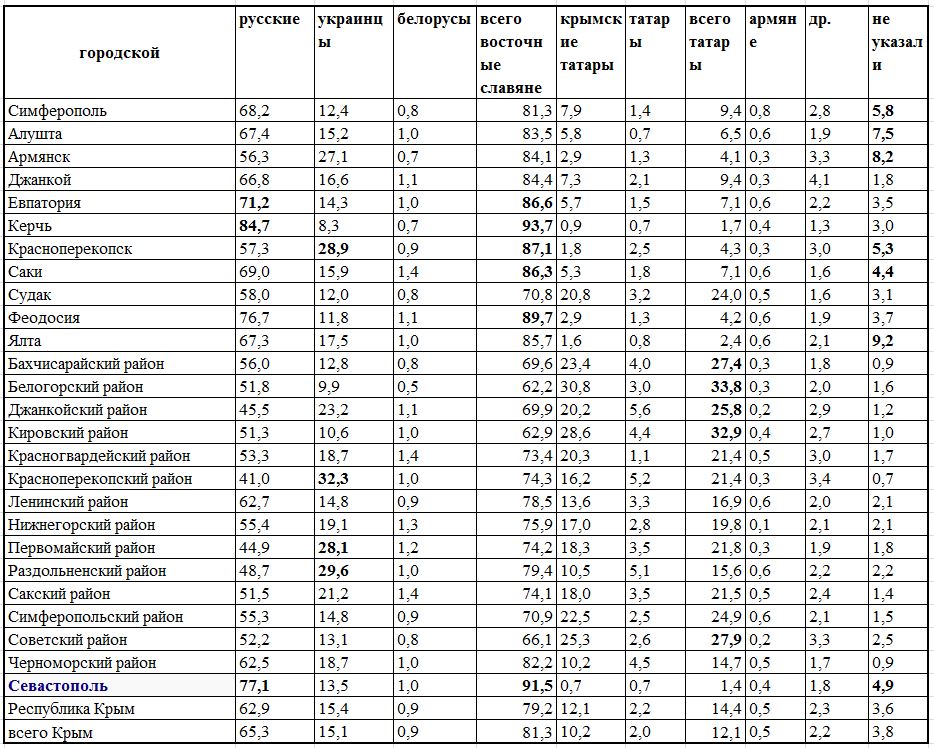
The highest values in the columns are highlighted in bold.
An interesting fact is that the proportion of those who did not want to indicate their nationality during the 2014 census in some cities of Crimea turned out to be quite high. In Yalta there were 9.2%, in Simferopol 5.8%, in Sevastopol 4.9%. The proportion of those who did not indicate their nationality is high in Armyansk and Alushta.
I tried to determine the dependence of the proportion of those who did not indicate their nationality on the proportion of persons of one or another nationality in the population of cities and regions of Crimea.
It turned out that the share of those who did not indicate their nationality correlates most closely with the share of Tatars (with the total number of Crimean Tatars and “just” Tatars). Moreover, the dependence is negative. The smaller the proportion of Tatars in a given territory, the greater the proportion of people who did not indicate their nationality.

From this, of course, it does not follow that all those who did not want to indicate their nationality during the 2014 census are Tatars, but this possibility should be taken into account.
Therefore, I think it will be interesting to look at the tablet, which brings together data on the number of Tatars (Crimean Tatars and “just” Tatars) and persons who did not want to name their nationality.
Table 6. Changes in the number of Tatars by urban districts and regions of Crimea.

According to the census, the number of Tatars in Crimea over 13 years has increased by less than 19 thousand people, or only 7%. But, if we assume that a significant part of those who did not indicate their nationality are Tatars, such an estimate of the growth rate of the Tatar population may turn out to be very underestimated. Particularly important is the fact that the bulk of those who did not wish to indicate their nationality were in Simferopol, Sevastopol and Yalta.
So, 2/3 of the population of Crimea are Russians, every seventh is Ukrainian, every eighth is Tatar. But, taking into account those who did not want to indicate their nationality, there may be significantly more Tatars. And the reduction in the total number of Russian residents of Crimea, which has not yet been overcome, is accompanied by an increase in the number and concentration of the Tatar population in large cities. There is probably nothing dramatic about this, but it is an interesting trend and should certainly be taken into account.
Recent events have drawn public attention to the political preferences of the population of Crimea. To a large extent, they are determined by the ethnic composition of the current autonomous republic within Ukraine.
The evolution of the ethnic structure of the Crimean population is presented in the following graphs and table. It should be noted that the first graph “Population of Crimea”, borrowed from Wikipedia, does not contain data from the 1970 census, but there are columns relating to April and July 1944 - before and after the deportation of the Crimean Tatars 18-20 May 1944. The second graph and the table “Population Structure of Crimea” contain data from the 1970 census, but there are no quantitative estimates of the ethnic composition of the population in April and July 1944.

Population of Crimea in
XVIII
-
XXI
centuries
| Dates
Total, thousand, people |
As a percentage of the total population: | |||||||
| Crimean Tatars, Turks, Tatars | Crimeans, Karaites, Jews | Greeks, Armenians, Bulgarians, Belarusians, Moldovans, Georgians | Ukrainians | Russians | Germans, Poles, Hungarians | Other | ||
| 1st quarter 18th century | 467,0 | 95,1 | 0,2 | 4,7 | ||||
| 1760-70s | 454,7 | 92,6 | 0,3 | 7,1 | ||||
| 1793 | 127,8 | 87,8 | 12,2 | |||||
| 1795 | 156,4 | 87,6 | 2,3 | 2,6 | 1,3 | 4,3 | 0,1 | 1,8 |
| 1816 | 212,6 | 85,9 | 2,3 | 2,5 | 3,7 | 4,8 | 0,7 | 0,1 |
| 1835 | 279,4 | 83,5 | 2,0 | 3,9 | 3,1 | 4,4 | 0,7 | 2,4 |
| 1850 | 343,5 | 77,8 | 2,2 | 3,5 | 7,0 | 6,6 | 1,0 | 1,9 |
| 1858 | 331,3 | 73,0 | 2,6 | 4,3 | 4,0 | 12,6 | 1,5 | 2,0 |
| 1864 | 198,7 | 50,3 | 7,0 | 11,0 | 7,2 | 21,3 | 2,7 | 0,5 |
| 1897 | 546,7 | 35,9 | 4,4 | 5,9 | 11,8 | 33,1 | 7,0 | 1,9 |
| 1917 | 749,8 | 29,4 | 6,4 | 5,9 | 8,6 | 41,2 | 5,7 | 2,8 |
| 1920 | 718,9 | 26,0 | 7,5 | 6,5 | 7,4 | 44,1 | 6,7 | 1,8 |
| 1926 | 713,8 | 25,1 | 6,1 | 5,4 | 10,9 | 42,2 | 6,1 | 4,2 |
| 1934 | 832,0 | 23,8 | 8,1 | 3,1 | 10,9 | 44,0 | 6,1 | 4,0 |
| 1937 | 996,8 | 20,7 | 5,8 | 3,7 | 12,9 | 47,7 | 5,1 | 4,1 |
| 1939 | 1123,8 | 19,4 | 5,8 | 4,3 | 13,7 | 49,6 | 5,0 | 2,2 |
| 1944 (late summer) | 379,0 | 0,0 | 21,0 | 75,0 | 4,0 | |||
| 1959 | 1201,5 | 0,0 | 2,2 | 2,3 | 22,3 | 71,4 | 0,1 | 1,7 |
| 1970 | 1813,5 | 0,4 | 1,4 | 3,9 | 26,5 | 67,3 | 0,2 | 0,3 |
| 1979 | 2135,9 | 0,7 | 1,1 | 2,7 | 25,6 | 68,4 | 0,3 | 1,2 |
| 1989 | 2430,5 | 1,6 | 0,7 | 3,0 | 25,8 | 67,0 | 0,3 | 1,6 |
| 2001 | 2024,1 | 12,0 | 0,3 | 2,6 | 24,3 | 58,3 | 0,4 | 2,1 |
Data for Russians and Ukrainians in 1864 - estimate.
Data for all years except 2001,- for the entire peninsula, data for 2001- only for the Autonomous Republic of Crimea.
Changes in the ethnic composition of the population of Crimea provide food for more than one publication. At the moment, I think it is possible to dwell on only a few observations.
1. Crimea is one of the territories of the former Russian Empire/former USSR that has experienced radical changes in its ethnic composition in the last two and a half centuries.
2. The key factor in radical changes in ethnic composition is changes in the nature of the dominant political regime and in the political situation.
3. Before the annexation of Crimea by Russia (1783), the Crimean Khanate was an almost monoethnic state; Crimean Tatars made up over 92% of the total population.
4. Crimean Tatars remained the absolute majority on the peninsula (over 50%) until 1864, and also a relative ethnic majority until the end of the 19th century (about 36% in 1897).
5. Over the course of about a century and a half (1783 - 1944), the Crimean Tatars experienced three major demographic catastrophes - after the annexation of Crimea to Russia (1780-90s), after the Crimean War (1850-60s), May 18-20, 1944 As a result of the first demographic catastrophe (primarily emigration), the size of the Crimean Tatar population in Crimea decreased fourfold, as a result of the second (emigration) - its number was halved from what was on the eve of the Crimean War, as a result of the third ( deportation) - almost all Crimean Tatars were evicted from Crimea.
6. In the second half of the 1980s, the return of the Crimean Tatars to their historical homeland began. According to the 2001 census, their number in Crimea was 243 thousand people, or about 45% less than there were on the peninsula for three centuries at the beginning of the 18th century. Taking into account natural and mechanical population growth, the number of Crimean Tatars by the beginning of 2014 may have approached 300 thousand people.
7. Since the beginning of the 20th century (1917), the largest ethnic group in Crimea in relative terms (over 41% of the total population) has been Russians. They became the largest ethnic group in Crimea in absolute terms (75%) in 1944 after the total deportation of the Crimean Tatars.
8. Over the next six decades, the share of Russians in the population of Crimea gradually decreased. According to the 2001 census, the share of Russians in the population of the Autonomous Republic of Crimea was 58.3%. Over 12 years, from 1989 to 2001, the number of Russians in the “big” Crimea (a hypothetical union of the Autonomous Republic of Crimea and the city of Sevastopol, which has a special administrative status) decreased by 179 thousand people, or by 11%. The share of Russians in the population of the “greater” Crimea for 12 years decreased from 67.0% to 60.4%.
9. Taking into account the demographic trends of the last 13 years, Russians in 2014 obviously make up approximately half of the population of the Autonomous Republic of Crimea (excluding the city of Sevastopol). It is possible that according to the results of the new census of Ukraine expected in 2016, Russians will make up less than half of the population of the peninsula (excluding the city of Sevastopol).
10. In the foreseeable future, in the absence of serious military-political cataclysms, Crimea will remain a region with a clearly defined multi-ethnic composition of the population, with Russians, Ukrainians, and Crimean Tatars remaining the largest ethnic groups.
According to All-Ukrainian population census conducted in 2001 in Crimea reside 2 million 24 thousand 56 people, and in Sevastopol - 377.2 thousand people.
What will the population census of Crimea, conducted from October 14 to October 25, 2014, which took place several months after the reunification of the peninsula with Russia, show? Already on December 17, the preliminary results of the population census were announced in Crimea.
Useful information for city guests: we have a good selection of housing for rent in Feodosia
The population of the Crimean Federal District in 2014 is 2 million 284.4 thousand people.

Such preliminary data were announced by the head of Rosstat, Alexander Surinov.
Of 2.2 million people the population of the Republic of Crimea is 1 million 889.4 thousand people, Sevastopol - 395 thousand people. Thus, The Republic of Crimea was in 27th place in Russia in terms of population, and the city of Sevastopol was in 77th place.
Moreover, the majority in the federal district belongs to the weaker sex: Women in Crimea make up 53.9% of the population, while men make up 46.1% of the population.
Information for tourists: apartments in Feodosia are available on our website for rent for summer holidays
The largest Crimean cities are Simferopol (350.6 thousand people), Kerch (147 thousand people), Yalta (133.6 thousand people), Evpatoria (119.3 thousand people) and Feodosia (101 thousand people).
Statisticians will complete data processing only in April 2015, and in May they will report on the results to the Russian government. It is by this moment that the national and family composition of Crimeans, their level of education and much more will become known.
The next population census in Crimea, as well as throughout Russia, will take place in 2020.
This was announced by the head of Rosstat, Alexander Surinov. He also said that in 2015 a micro-census of the population will be held on the peninsula. “We will cover only a few percent of the population and the questionnaire will be much longer,” said A. Surinov
On June 3, 2015, the conference “Results of the Population Census in the Crimean Federal District” opened in the city of Yalta.
Rosstat conducted a census of the population of Crimea - 2 million 285 thousand people
The head of Rosstat, Alexander Surinov, spoke about the results of the Crimean population census.
The census included the collection of complete data on the peninsula's population, its age and gender structure, national composition and language proficiency, citizenship, marital status, education, birth rate, economic activity, housing conditions, sources of livelihood, number and structure of households.
According to the head of the department, despite the short deadlines for the statistical research, the census in the Crimean Federal District was carried out in full compliance with the methodological and organizational provisions of the 2010 All-Russian Population Census and the UNECE recommendations for conducting the 2010 population and housing census.
According to the Census, 2 million 284.8 thousand permanent residents live in Crimea, of which 83% live in the Republic of Crimea and 17% in the federal city of Sevastopol.
There are 17 urban settlements and 1042 rural settlements in the region. There are 1,175 women per 1,000 men.
The largest city is Sevastopol, which is home to 393 thousand people. Almost half of the population of the Republic of Crimea (853.2 thousand people or 44%) lives in urban districts with a population of more than 100 thousand people.
In terms of national composition, there were 6 numerous nationalities in Crimea, the population of which exceeded 10 thousand people: Russians, Ukrainians, Crimean Tatars, Tatars, Belarusians, Armenians.
Representatives of other nationalities in the Crimean Federal District make up less than 3%. For almost 4% of the population, their nationality is not indicated on the census forms.
The state language of the Russian Federation - Russian - in the Crimean Federal District is spoken by 99.8% of the population who answered the question about language proficiency. When asked about their native language, 84% of the population answered that their native language is Russian, 8% - Crimean Tatar, 4% - Tatar and 3% - Ukrainian.
The number of citizens of the Russian Federation amounted to 2164.9 thousand people, or almost 98% of persons who indicated citizenship, 51.8 thousand people, or 2%, have citizenship of other states and 3.4 thousand people are stateless persons (0. 2%).
In the Crimean Federal District, the economically active population was 64% among people aged 15-72 years who answered questions about employment and job search. The economically active population consists of the employed (86% of this category of the population) and the unemployed (14%).
The Crimea peninsula is still one of the most relevant and discussed topics all over the world. The population of the Russian republic continues to experience a transition period associated with the annexation of the former autonomy to the Russian Federation. Well, oddly enough, not everyone is happy about what happened. Crimea has undergone a lot. The population has changed, a new currency has appeared, prices and salaries have changed. Well, then it’s worth talking about all this in more detail in order to understand the problem.
Background
Everyone knows that one of the most multinational peninsulas is Crimea. The population in this place is truly replete with diversity. Russians, Belarusians, Germans, Greeks, Jews, Armenians, Ukrainians, Crimean and Kazakh Tatars - who doesn’t live here! Indeed, as you can see, the Republic of Crimea has a very multinational population. But it is worth noting one interesting nuance. After the well-known referendum on March 16, when the residents of the republic finally made a decision regarding their return to the Russian Federation, the number of Tatars and Ukrainians living in the territory decreased significantly. Compare the statistics of 2001 with 2014! Then there were 24.4% Ukrainians, 12.1% Crimean Tatars. After the referendum - 16% and 10% respectively. Russians were 58.5%, but now 65.2%! You can see how the indicators have changed. The number of representatives of other nationalities has not decreased - it remains the same.

Changing statistics
Why did Crimea, whose population was so diverse, suddenly become poorer in Ukrainians and Crimean Tatars? The question is very serious, and it is difficult to answer it briefly. But it's real. Well, the Ukrainians decided to return to their “historical homeland”, flatly refusing to accept what is clear as day. That is, that the peninsula, in fact, always belonged to Russia and was given to the neighboring country because it happened that way. Everyone knows that situation. And the Crimean Tatars... this is a separate issue. It’s not even really clear why representatives of this nationality reverence the supposedly independent Ukraine so much. Most likely, the fear of deportation that occurred in May 1944 remained, and they can be understood. Well, so far the hostile mood has not completely passed and will most likely continue for more than five years, but we can only hope for the flexibility and prudence of people.

Latest data
So, in 2015, at the beginning of June, a conference was held in Yalta on issues related to what the population of Crimea is now. It is 2.2 million people. This is the most recent, latest data. The population of Russia and Crimea, accordingly, according to the latest statistics, has increased to 146,300,000 people! Some people think that two million on top is a drop in the bucket, but the whole republic has joined.
Everyone knows that the peninsula includes such a wonderful hero city as Sevastopol. A true legend. In addition, from now on it is a city of federal significance! A white-stone beauty, on the territory of which 400,000 people live. Thus, Crimea ranks 27th in Russia in the population ranking, and the hero city has dropped to 77th place.
Details
So, who and how many live on the territory of the Republic of Crimea? The population consists of 53.9% women and, accordingly, 46.1% men. As almost everywhere, the number of girls exceeds the percentage of boys.
The largest cities were recognized (with the exception of Sevastopol with a special status) Simferopol, Kerch, Yalta and Yevpatoria with Feodosia. 350,600 people live in the Crimean capital, in Kerch - half as many, i.e. 147,000. Yalta, or, as it is also called, the Crimean Pearl, contains 133,600 people on its territory. And Evpatoria and Feodosia - 119,000 and 101,000. The statistics are completely recent, the population census was conducted less than a year ago, so the data is the most reliable.
Results and conclusions
Well, as one could understand, Crimea is a rather large republic. And now it’s worth drawing some conclusions.
The most “Russian” city on the entire peninsula is Sevastopol. They called him that all the time. On its territory, about 99% of people are Russians. Now not only by nationality, but also by citizenship. In general, the national composition is quite large. The most numerous, besides Russians and Ukrainians, are also Belarusians, Kazakhs and Armenians. Representatives of other nationalities live in less than 3%. Interestingly, approximately 4% of people did not indicate their membership in a particular group during the census. The “nationality” column remained empty.
According to statistics, it was found that 99.8% of residents of the federal district speak Russian, that is, the state language. 84% of all said that it is their native language. 8% named Crimean Tatar as such. Ukrainian is the native language of only three percent, and traditional Tatar is the mother tongue of four.
And finally, the following data: 98% of all already have a passport of a citizen of the Russian Federation, 2% have an identity card from other states, 0.2% have no citizenship at all.